I am pissed !
I saw that problem many tims (betracker graph changing)
RB are your all graphs/stats random ? showing “not statistics truth” ?
how can we be sure of the statistics and graphs you are showing us here?
please explaing me
why is graph changing after X days without betting ?
I understand that you can change EV, recalculate something, but are you calculating that all the time ? every day ? do you calculate that X days after bet ended ? I do not believe that
My ‘reports’ show a + 278, but looking at my starting balance - current balance - current exposure = is not + 278…? I request data in excel to to see if I can dig into to it further but hat is not availble ATM, they are working on it.
There was a ‘new version’ released today. Last time that happened I had ‘bad variance’, this time, last 6 hours, not getting many bet options.
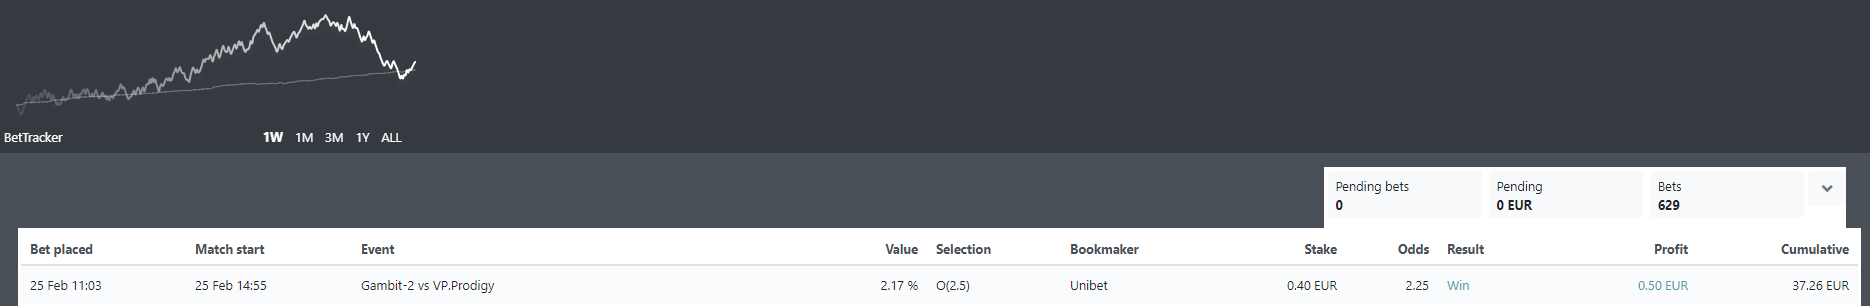
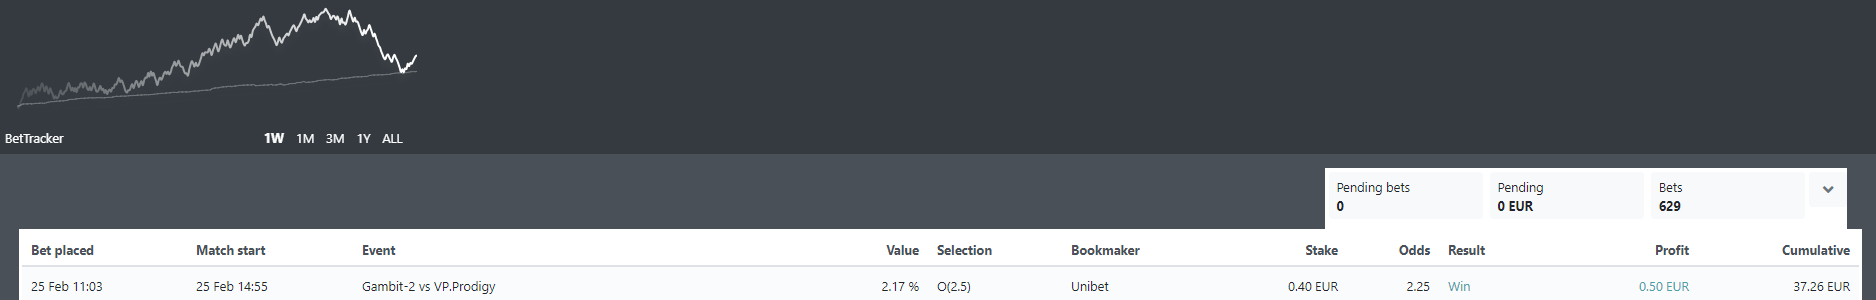
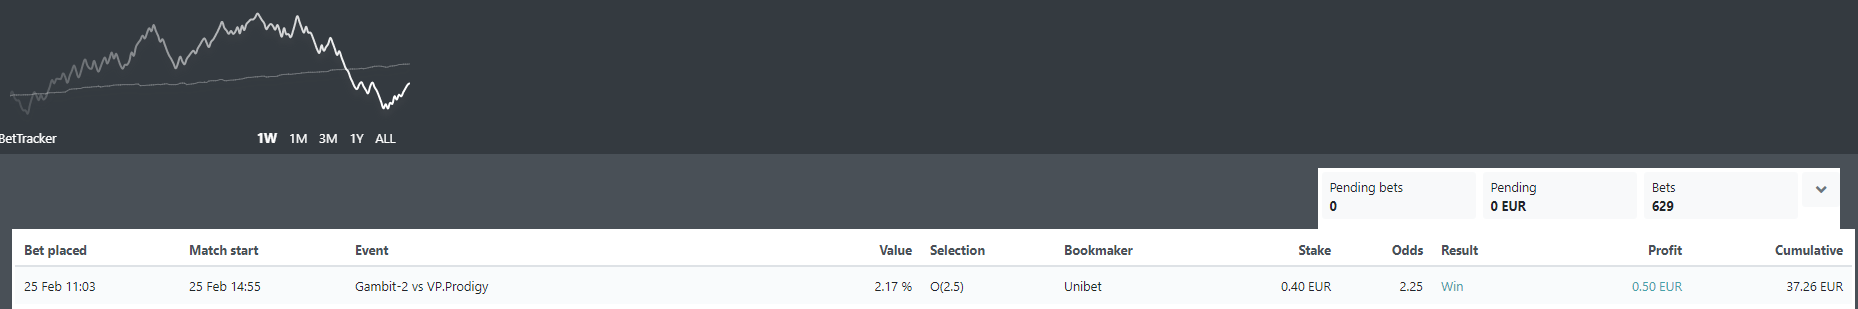
Your graphs are even stranger. Perhaps RB can explain… I guess it is time related v’s expect bets…? RB should reply to customers on this sort of stuff
I checked the chart, and it’s actually working as designed. What’s causing confusion is that both lines always start from zero. And that 1 week means we start exactly 7 days (or 10080 minutes) back.
So even if image 2 is only a few minutes later, you’re now starting from the tiny downswing. So the CLV from that exact point is correct. The difference looks even greater a few days later when you started from the big upswing.
However, I fully agree this is confusing so I will change it so that 1 week means “7 days back, always starting at previous midnight”. This means “1 week” will always start at the same position for 24 hours, then change the starting position at midnight. So “1 week” will show up to a 8 days at 23:59. Will this be an OK fix?