
Is it me only or do u have the same results??!!!
It has been bad 48 hrs for me
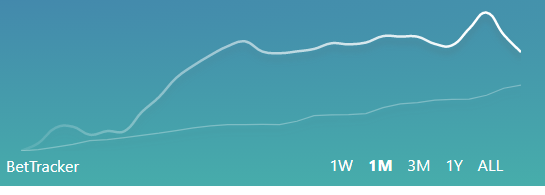
There was a notification just a few days ago that RB had a ‘new version’, I assumed it was automatic that performance would improve.
I blindly follow that I am betting on ‘value bets’, but the results look like I am just betting…
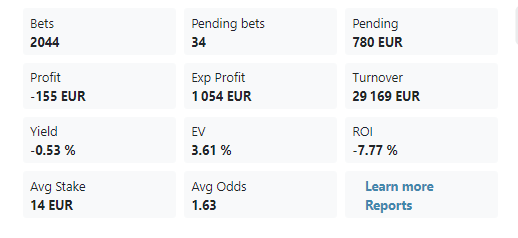
I’m on 1650 bets. Done about 70 bets/day during this down turn (3 days), which is above my average, so looks like the ‘more is more’ concept is not working.
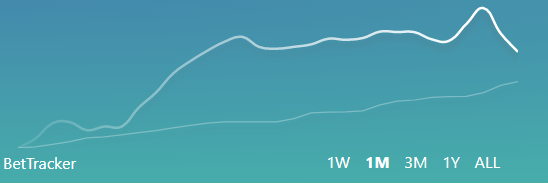
I was happy with the recent ‘up’ using a 35% kelly. I then dropped to a 30% kelly to protect some gains, but since then it has been dropping pretty hard.
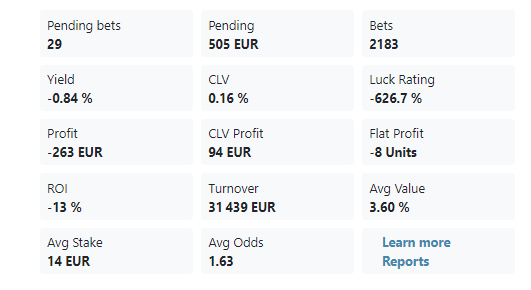
Can RB explain; new update and dropping yield? Also, my report does not show where I am losing - is this function working? I would like to analyse the data to determine best strategy, or do I blindly belief your ‘xx% value bet’ and believe in variance?
At least I’m not -ve. But at this rate it won’t take long…
The results didn’t improve!!!
Also after the last update i noticed my luck rating is terrible.So unlucky???
Could you guys share a little bit more information about the following factors:
These information is in Options and Filter menu.
Thanks,
Gabor
Fairly standard I think…
[/quote]
Thanks for sharing. What I would do in long-term is to check how each bookmaker performs in different sports (Soccer, Basketball etc.) and place bets on those which have a positive result (Yield % is positive). As a matter of course you can’t draw strong conclusions after 220 bets… and to acquire this information you may develop your own spreadsheet which is a manual work and not everybody likes to do it.
Short-term advise is:
I am not an expert just try to utilize what I have read in different topics and what my statistics show after nearly 3000 bets. Let me know how it works. Good luck 
I have the same advise for you as in my previous post. Add a few more (sharp) bookmaker and you may change the “time to match start” to 12 or 24 hrs. I am not quiet sure about the timing, you can play with it and see which is the best for you.
I would also be a little more brave and set the odds max to 3.0 at least.
Hope it helps.
I would like to drill into the data a bit further.
RB has data and shows me the % rate on bookies, and % rate on sports, but don’t allow a filter to see sports in a particular bookie so you can see where the value is, or isn’t.
Another feature that would useful is to be able to then filter the VBs at each bookie by sport e.g Unibet - Football and Basket ball, Coral - Esport.
I think this would also reduce the chances of stake restrictions as your betting is more consistent at that bookie.
RB have the data, they currently process the data in the reports, I think a few much features in this area to allow filtering and categorizing would be useful. Yes, I could keep a spreadsheet of everything, but the data already exists so why should it be double work.
I’ll have a play with the settings and push the odds out from 2.5 to 3.0 and see what happens.
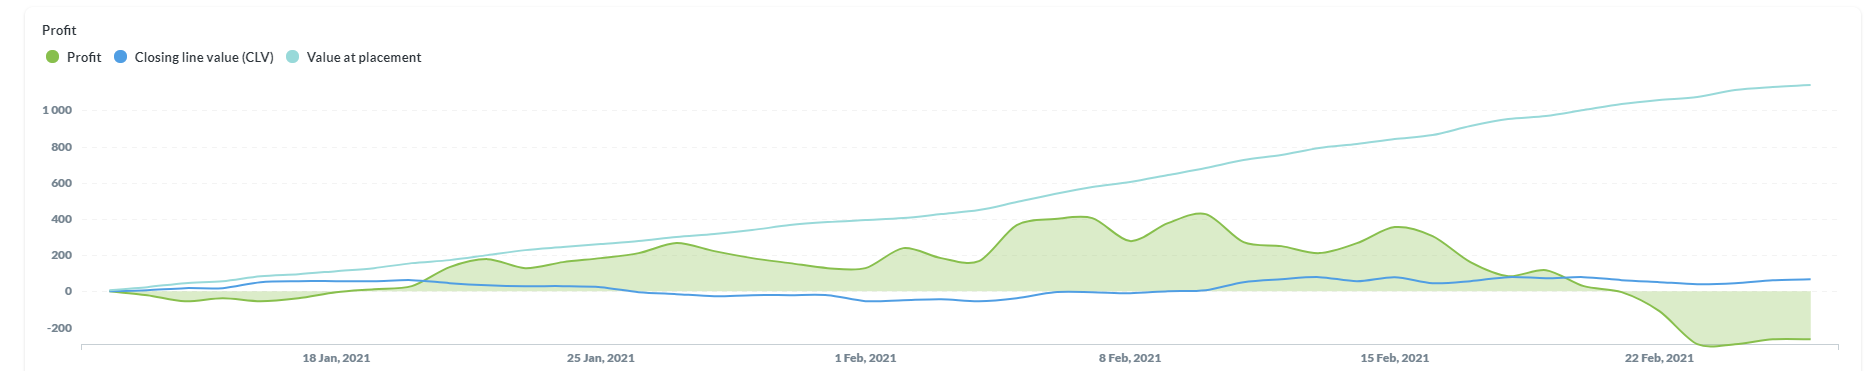
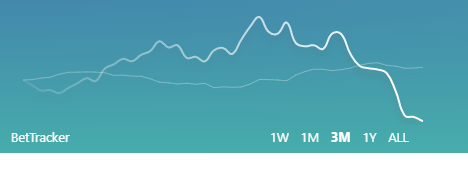
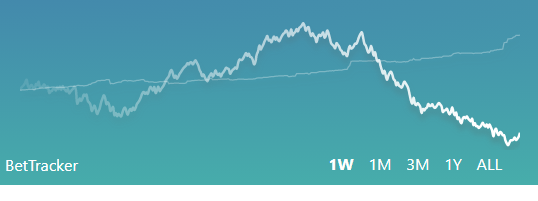
I just can’t understand what has happened this week… The drop is steeper that i’d expect from variance when the settings are the same. (Obviously I like the up part of the curve 
Don’t think too much about the settings and filters. Only change them if you can’t turnover enough of your bankroll or you turnover your bankroll too fast. For example, on weekdays I keep the start time at 48 hours, and on weekends when there’s a ton of bets I lower it to 24 hours.
For me, tennis was -15% after 350 bets but now after 500 bets, it’s +2%. If you don’t have significant data(thousands of bets) on markets and sports you shouldn’t draw ANY conclusion about them.
I tend to agree this is a long game approach and turnover and high volume smooth the curve to a positive.
However, why blindly wager money when there is data available to optimize your profits, or at least reduce your losses.
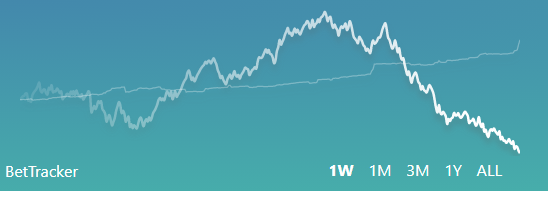
I’d like to understand why when my curve was turning up and positive returns. There was Aus Tennis open, did that increase my yield…?
I’d also like to understand the other side, its heading down now, why? What changed in the this week v’s last week?
I see potential in VB but would like to optimize it further.
If you remove bookmaker or market only because it has a negative yield after couple hundred bets, you’d most likely remove a bookmaker or market that is profitable in long term. If you have enough of data, again thousand of bets or closing line values then you can and should optimize your settings.
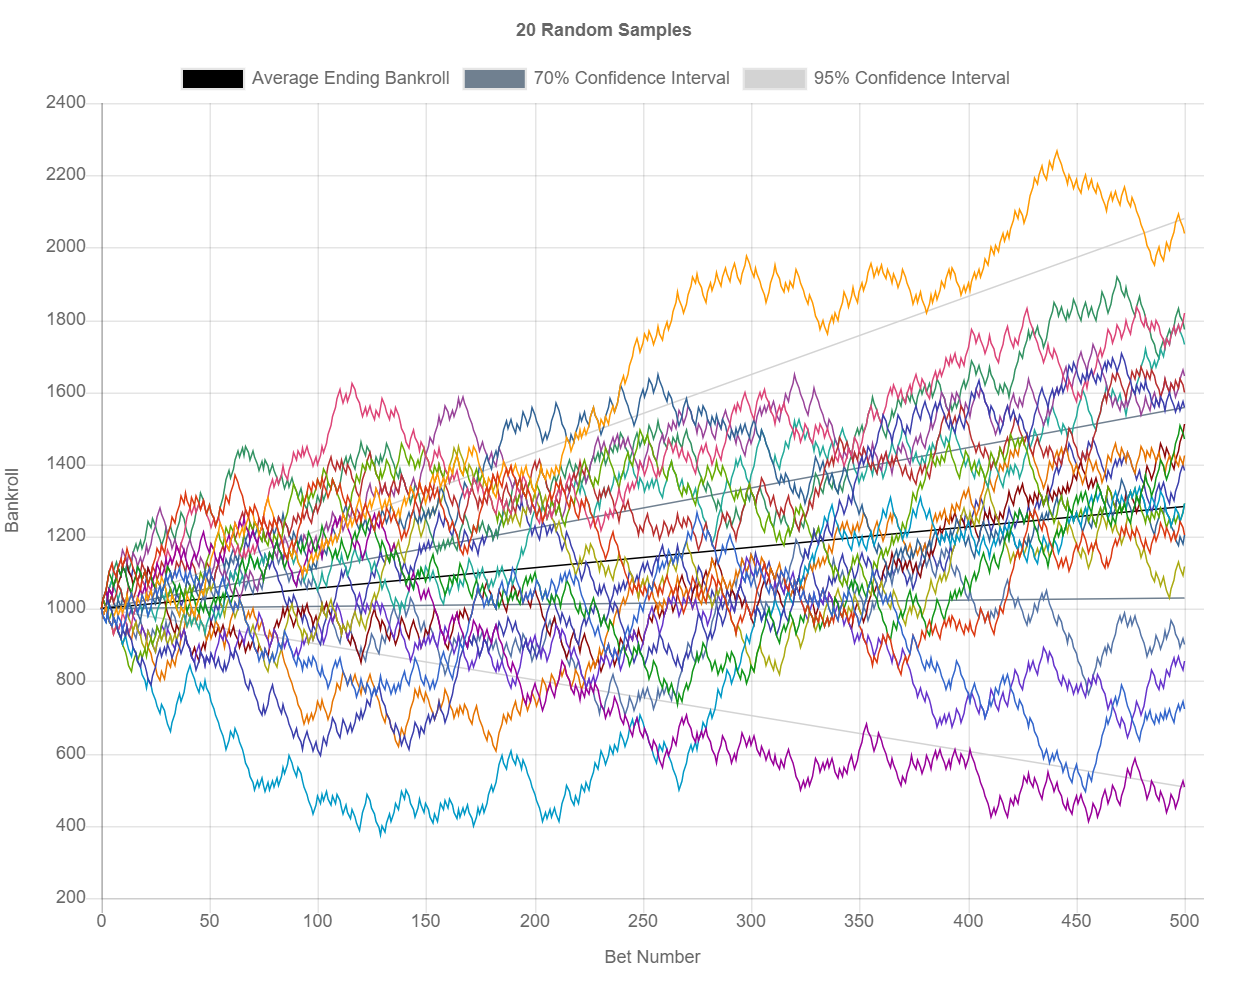
Nothing. Even if you would be betting on a confirmed 3% edge on every bet (which you are not because only 80% of bets beat the closing line) you would still experience huge downswings and losses. Here are 20 simulations on 500 bet runs where EVERY BET has a 3% edge. You can see how there still are downswings.
Interesting graph. Indicates that you need a fair distribution of bet types (sports/odds/margin) and volume of bets to reach a median.
The title is ‘20 random samples’. But why is the yellow +ve line going up and the purple -ve line going down.? There must be a reason for this, or at least a conclusion could be made if analyzing those particular lines.
I want to be closer to the yellow trend than the purple trend. 500 bets isn’t that many, what happens after 3000 bets? Is purple up and yellow down?
I see the graph, but i don’t have the data or or other information behind it to form a opinion on if it is useful or not. It shows about 60% winners, 40% losers and 10% a draw.
I’m hopefully turning a corner…
It’s just variance… there is no reason behind it and nothing you can do. I’ll try to oversimplify this to you.
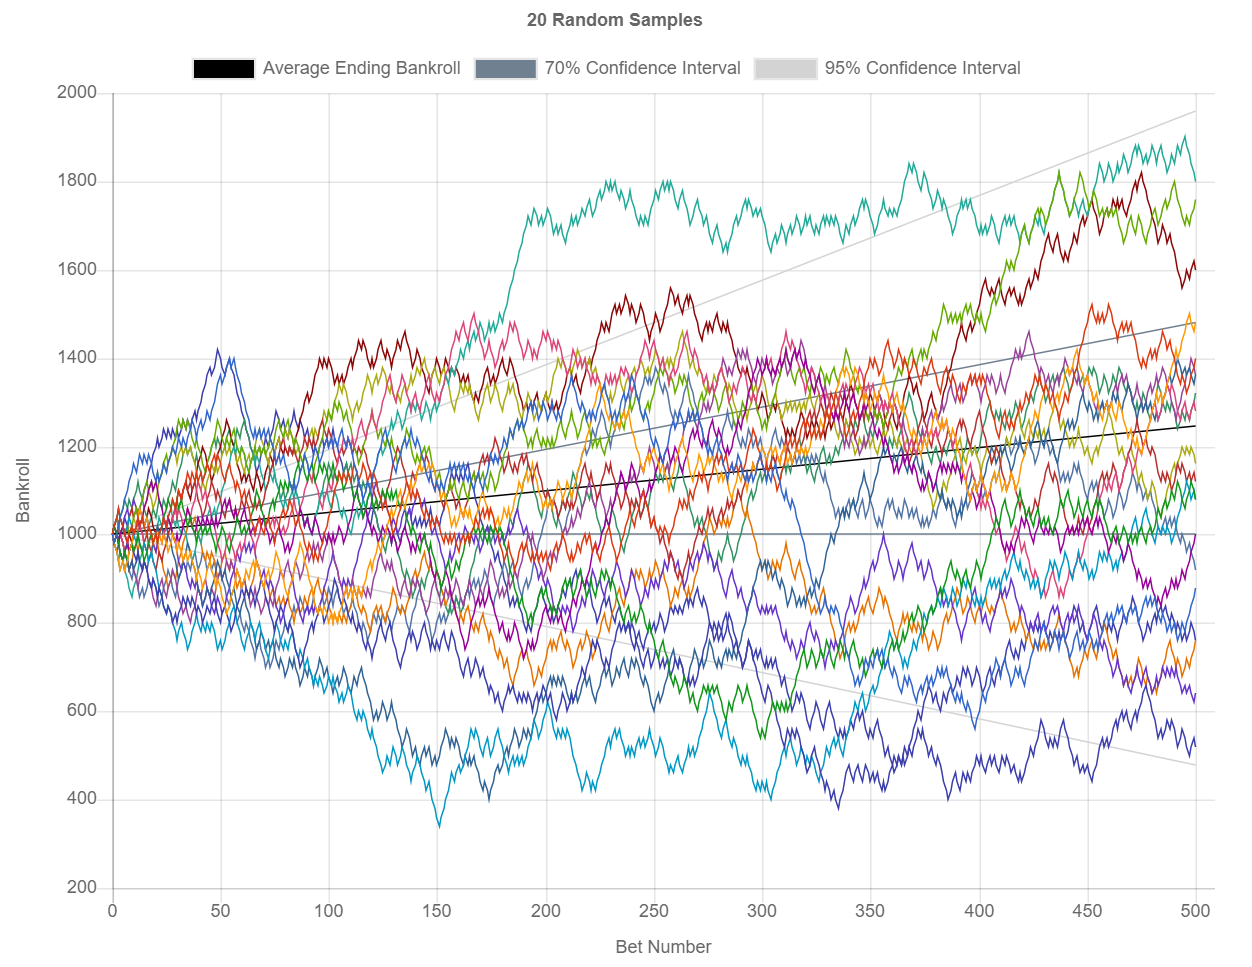
Here are 20 simulations on betting tails in a coin toss with odds of 2.05
See how 7/20 didn’t even make a profit even though there was a confirmed 2.5% value on a coin toss.
It’s variance and 500 bets are not enough to get statistically significant data.
Thank you for providing some background to the graphical data. Coin-flip x 500
Indeed coin flip is binary and calculable odds. Keep flipping the coin and you will get back to ‘zero’.
With Value Betting, there are a number of other factors; % value, sport, tournaments, RB software accuracy. These are all factors. How often have you checked the RB prices v’s a sharp bookie? (just out of interest). I do it occasionally wit BetFair of Smarkets.
I agree that volume of bets on +ve value (verses Pinnacle baseline) should give +ve ROI. However, that is not to say that you should not analyze the data (sports, bookie, odds) to determine if there is ability to improve profits by reducing losses.
Example; below 1.75 odds with +3% value = more profit than an 2.0 with 6% value on Basketball on a Saturday. (this is a hypothetical example)
That way too much detail, but you could conclude that because of the volume of bets on US basketball on the weekend the value is more accurate (or visa versa). Maybe less bets on weekend basketball and more bets on Monday night soccer…
If you don’t think that this optimization would be useful, you might as well just bet on Pinnacle and remove RB, because we assume Pinnacle or sharps have the correct odds. At some point you will be in profit, take your money, pay some bills and start again. Maybe the next week you will be down, but carry on and you will get back to zero.
The RB ‘reports’ show which sports are +ve, which bookmaker is +ve. RB think this information is useful, or perhaps not, i don’t know why they categories it.
The point of RB is to identify +ve value bets, it is scanning software. But, why not determine where the actual profit is v’s RB value…?
We are not betting on flipping a coin… The result is binary, but it is not coin flip odds.
No. With odds of 2.05, you would make a 2.5% profit.
What? No, you wouldn’t. ![]() Pinnacle has margins. Your yield would be about -5%.
Pinnacle has margins. Your yield would be about -5%.
If all user results are combined every sport, every market, and every soft bookmaker is on profit.
Yes, but my point this whole time has been to not make any conclusions solely based on results after couple hundred bets. Just like betting on tails with odds of 2.05, you can be on a loss after 500 bets, would you stop betting on tails with odds of 2.05? If your only data to make “optimization” is your results, you will need a five-digit number of bets (on that market) to be sure the results are not just randomness. If you have some other information, for example, you know that Swedish bookmaker is sharp on Swedish sports, then sure use that information.
The reason this feature should not be implemented is that some users would think “oh basketball on Bet365 has -2% yield after 80 bets, I should stop betting on it”, even though the results are just randomness. Although, this feature would be useful if it would show combined user results when the sample size is large enough. And as I understand devs are considering it.
The downswing you experienced is nothing considering you are still above your CLEV. User @svh said it well. “At some point, everyone will go on awfully bad downswings. It is guaranteed. There is no way of avoiding it. Mentally prepare for the fact that eventually you will downswing 30, 40, 50% of your bankroll. That might be now, it might be when you have a 50k bankroll, it might be both.”
I think the devs are tired of explaining variance and randomness. That’s probably why they didn’t even answer your initiall question. Every time a new user experiences a normal downswing or has a poor start they come here complaining that the software is broken without even understanding how the software works. I once went 2000 bets without profit, but since then I have doubled my profits. You know what settings I changed and what optimizations I did? The answer is nothing.
It is all about the variance mate. I can tell that the bet numbers around 5000 are still not enough to judge your future results. I have placed about 7k bets and made 180% profit so far. I had many up and downswings from the number 0 to 7k. The worst one was losing 40% during 3 days, and the best one was getting 80% profit during 2days.
The variance is a big part of sports betting. Simply yes, it gets more profits if you keep betting as RB said but the condition is it has to be very long term. So just keep it up and don’t give up too early. You will have suddenly a really good upswing and be able to see your graph goes up high.
Thanks a lot @Jakob for your very detailed explanations! I know how difficult it can be to explain variance and probability.
I might use your 500 coin flips example in the future 
Please use Jakobs example. You might want to make him less angry if you plan to C&P…
Hey Jakob, How do you create those graphs?